
")

Volume and Trends
Wool Production & Measurement Trends
AWTA's database contains extensive information for the number of bales tested, the weight of wool tested and associated objective measurements. As almost every lot of wool sold in Australia is certified for Yield and Fibre Diameter before sale, and because the certification services available since 1991/92 have been solely provided by AWTA, this data correlates closely to the production of wool in Australia.
The AWTA's database contains extensive data on the number of bales, weight of wool tested and objective measurements.
Wool Production by Statistical Area
AWTA’s testing database contains extensive information on the origin of wool sampled and the region in which the wool was grown. The sample location is identified by AWTA Sampling officers as part of the certification of sale lots, whilst the region in which the wool is grown (known as Wool Statistical Area – WSA) is declared to AWTA by the Broker/Seller. The image below shows the annual change in WSA-based wool production since 2000.
AWTA’s Key Test Data (KTD) reporting is based on the sample location whereas the data summarised in this section of the website looks at WSA based production. Though the overall comparison of KTD and WSA production levels are consistent, there are slight differences in the figures of each State due mainly to:
- WSA information not being provided by the seller
- The handling and marketing approaches of sellers, whereby wool grown in one area is transported for storage and sale in another state
This data is the basis for the following analysis of trends in wool production.
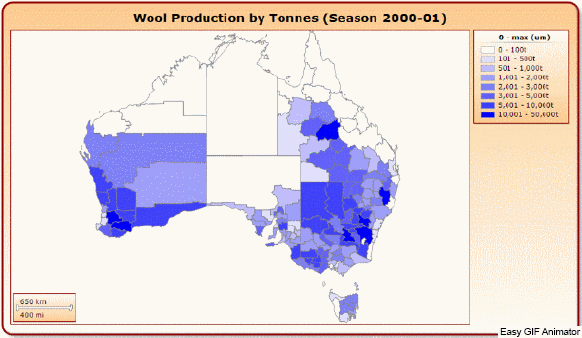
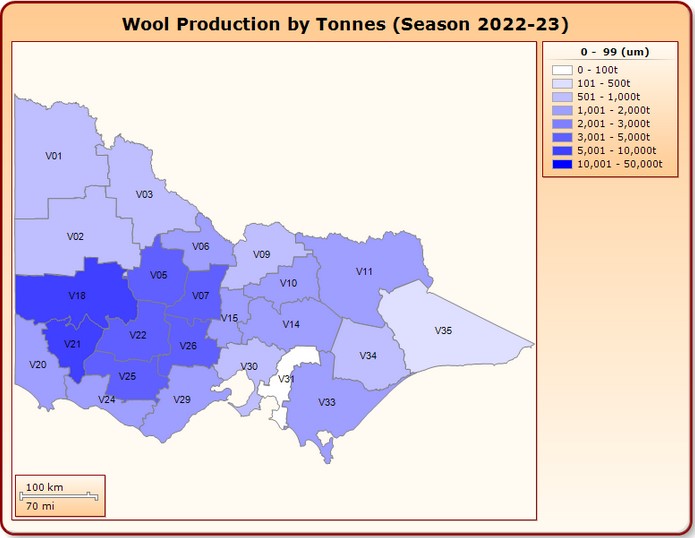
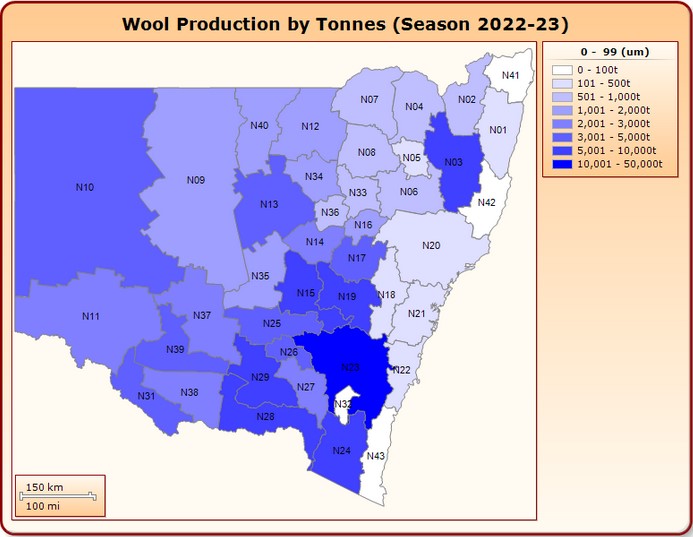
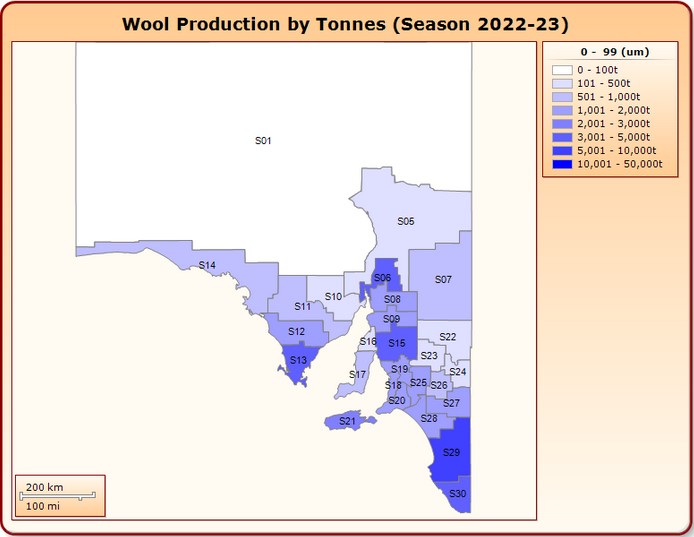
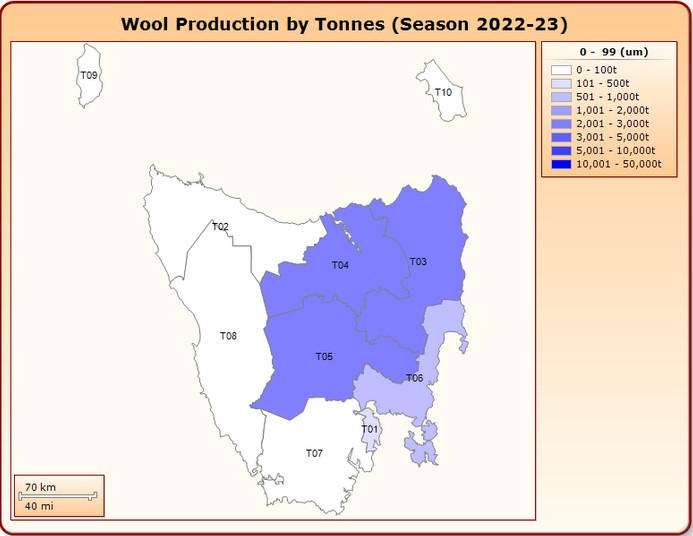
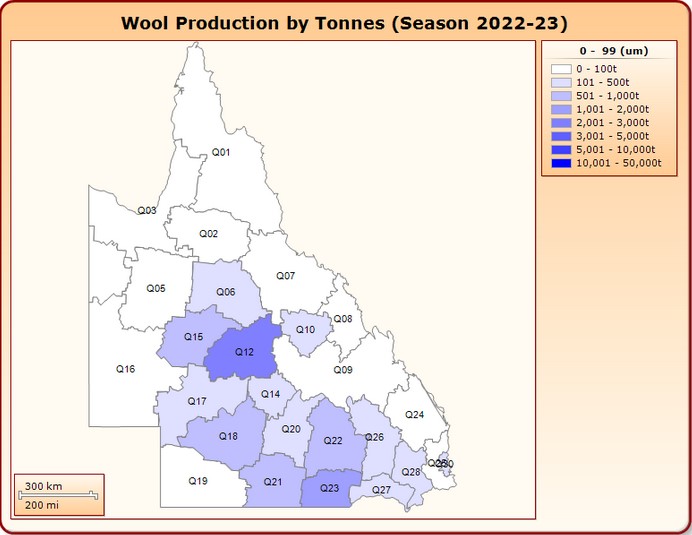
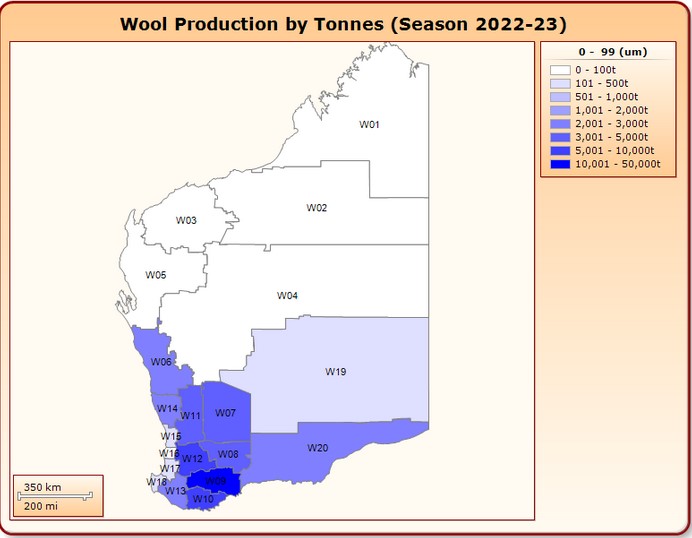
WSA Production Maps
Displayed below are maps showing the tested wool production within each state by WSA for the last season. Colour graduations are used to show the relative changes in wool production in each area; the darker the colour the greater the amount of wool.
 |
||
 |
||
 |
||
 |
||
 |
|
|
 |
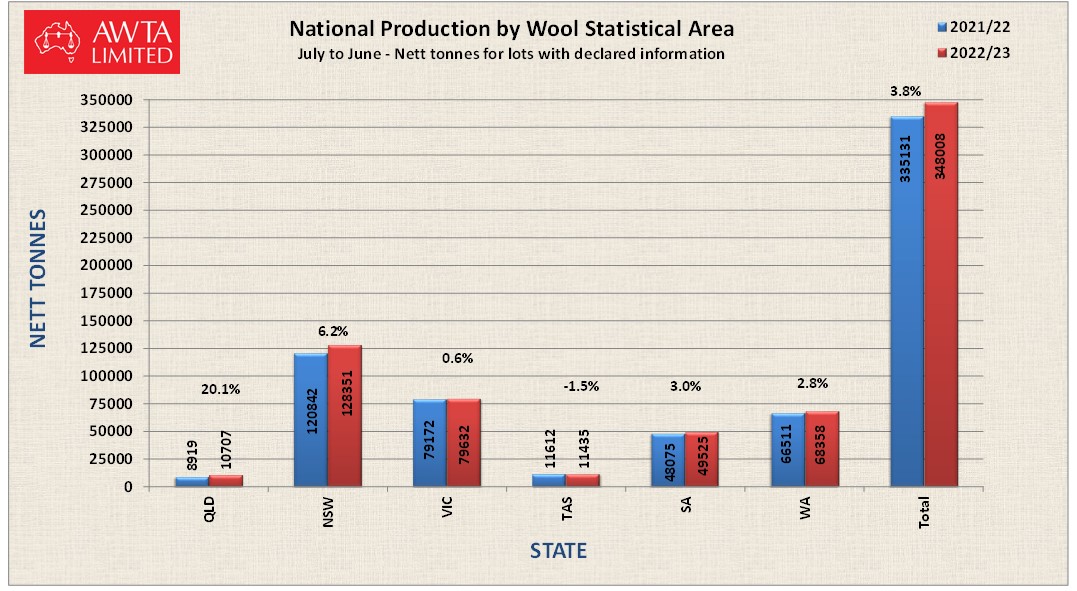
Year-on-Year Comparison by State & WSA
The following charts show the volume of wool tested from each State for the current and previous selling seasons across each Wool Statistical Area (WSA) and the % change from season to season.
Download a more detailed comparison: AWTA Wool Statistical Area Report - National ![]()
Fibre Diameter
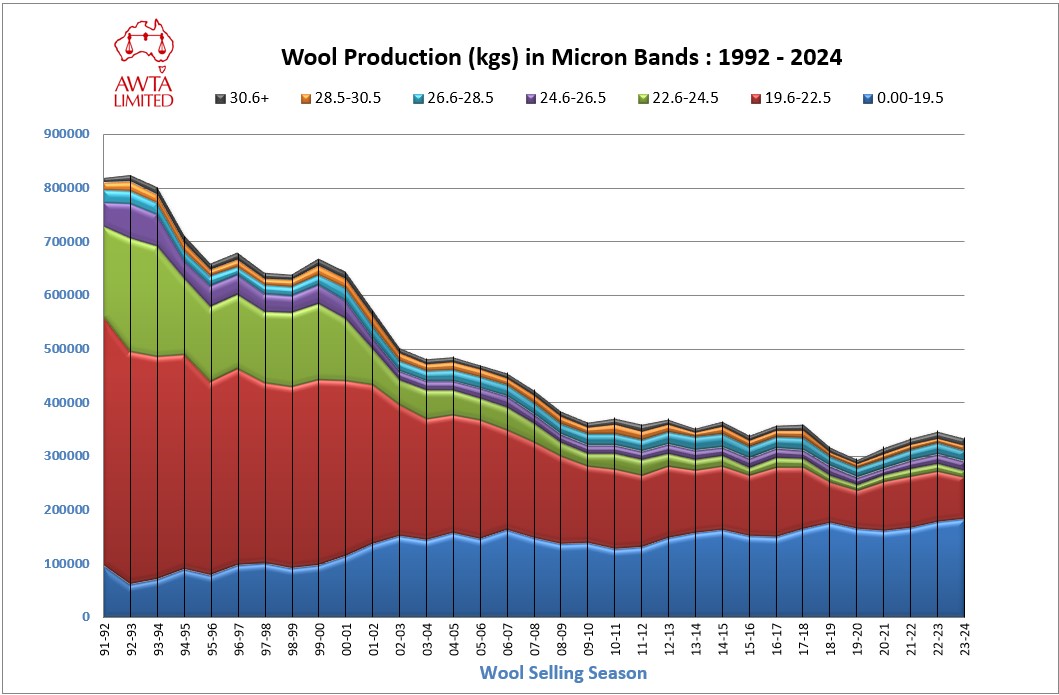
Mean Fibre diameter (Micron) is the single most important measurement used to determine the value of raw wool. The measurement is expressed in micrometres (microns) and refers to the average diameter of fibres in a sale lot. In general terms, the finer the wool the more it is worth. This relationship has led to a lowering of the average fibre diameter over recent seasons, with the proportion of fine wool (ie. <19.5 microns) increasing as a total percentage of the wool produced each year.
AWTA's testing database contains extensive data on the range and distribution of fibre diameter measurements conducted on the Australian Wool clip since 1991/92. The seasonal changes in the micron profile and related production trends are provided for download below.
Trends in Mean Fibre Diameter
Download the full Micron Trends report: Trends within Micron Range
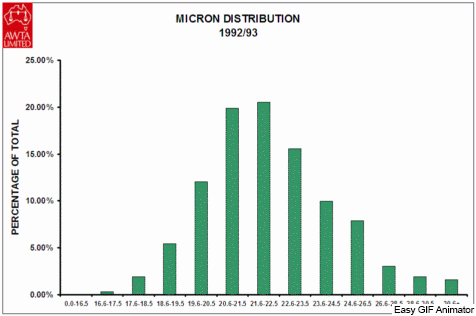
Micron Profiles
The animated GIF below illustrates the progressive changes to the micron profile of the Australian Wool clip since 1992/93.
The most noticeable change is the significant increase in the proportion of fine wool (<19.5µ) and crossbred wools (26-30µ) since 2000/01 which is reflected by the bi-modal distribution.
Download the full Micron Profile Report: AWTA Historical Micron Profiles![]()
The Finest Certified Tests Measured by AWTA
Australia is renowned for producing the world's best merino apparel wool. Premiums exist for bales of wool with the lowest fibre diameter or 'finest Micron'. There is competition among specialist producers of fine wool to hold or break the record for the finest bale.
The table below is a historical list of the finest sale lots tested and certified by AWTA Ltd. Whilst there may be others that have achieved the same mean fibre diameter (MFD), the lots listed here were the first to be measured at the respective micron values.
|
Tested |
Laboratory |
Brand |
MFDµ |
Method |
| Nov-23 |
Melbourne |
ROWENSVILLE |
10.9 |
L |
|
Jan-16 |
Melbourne |
PYRENEES PARK |
11.0 |
L |
|
Nov-11 |
Melbourne |
HIGHLANDER ULTRAFINE |
11.1 |
L |
|
Jun-11 |
Melbourne |
PYRENEES PARK |
11.2 |
O |
|
Dec-09 |
Melbourne |
HIGHLANDER ULTRAFINE |
11.4 |
L |
|
Nov-08 |
Sydney |
HIGHLANDER ULTRAFINE |
11.5 |
L |
|
May-05 |
Sydney |
HIGHLANDER ULTRAFINE |
11.6 |
L |
|
Mar-06 |
Melbourne |
KADINIA/BRIM |
11.7 |
L |
|
Nov-04 |
Melbourne |
WOOL FACTORY/HORSHAM |
11.8 |
O |
|
Feb-04 |
Sydney |
PRIMERINO |
11.9 |
O |
|
Feb-03 |
Melbourne |
NERRAWAK |
12.0 |
O |
|
Apr-02 |
Sydney |
HIGHLANDER ULTRFINE |
12.1 |
O |
|
Jan-02 |
Melbourne |
NERRAWAK |
12.5 |
O |
|
Apr-01 |
Sydney |
HIGHLANDER ULTRFINE |
12.9 |
O |
|
Mar-00 |
Melbourne |
KARROO |
13.2 |
A |
|
Mar-98 |
Melbourne |
WOOL FACTORY/HORSHAM |
13.3 |
A |
|
Nov-97 |
Melbourne |
WOOL FACTORY/HORSHAM |
13.4 |
A |
|
May-96 |
Melbourne |
WOOL FACTORY/HORSHAM |
13.5 |
A |
|
Mar-95 |
Melbourne |
KADINIA/BRIM |
13.7 |
A |
|
Dec-94 |
Melbourne |
KADINIA/BRIM # |
13.8 |
A |
|
Jan-93 |
Melbourne |
KADINIA/BRIM |
14.3 |
A |
|
Jan-92 |
Melbourne |
KADINIA/BRIM |
14.5 |
A |
# Now known as the "Million Dollar Bale"Note: Methods are:
(L) Sirolan Lasercsan - introduced from July 2000
(O) Optical Fibre Diameter Analyser (OFDA)
(A) Airflow meter (replaced by Laserscan)