
")
Latest News
Transition of Ownership – Australian Wool Traceability Hub (AWTH)
There is no translation available.Australian Wool Innovation (AWI) and the Australian Wool Testing...Key Test Data Summary for October 2025
There is no translation available.The monthly comparisons of Total Lots, Bales and Weight tested...AWTA Operational Update: Testing Volumes and Service Times
There is no translation available.Due to a recent surge in demand for AWTA testing services...History of the Statutory AWTA 1957 - 1982 (David J Ward OAM)
There is no translation available.This history of AWTA Ltd traces its evolution from a government...Key Services
- Wool Sampling
- Wool Testing
- Research & Development
- Certification & Reporting
- Equipment Manufacturing
- Certificate Verification
- AWTA Analytics (on-line Key Test Data)
- Subscribe to our newsletter
About Us
About Us
AWTA原毛检测部门为毛纺工业提供独立和公正的客观检测和出证的服务。AWTA原毛检测部门的主要工作内容包括取样、检测并且对羊毛的洗净率、草杂含量、纤维细度、毛丛长度与毛丛强度进行出证检测。这些检测结果是澳毛贸易不可缺少的内容。


Statistics
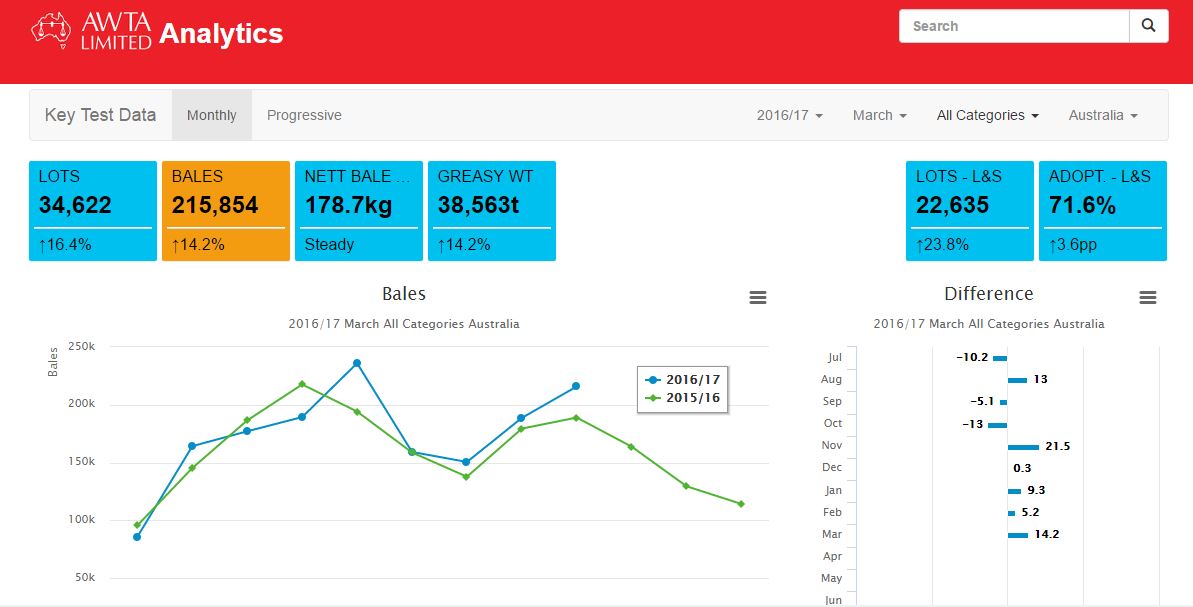
AWTA Analytics
Often refered to as Key Test Data, this free service includes access to current and historic testing volumes and test averages.
The AWTA Analytics service features:
- Bales, Lots and Volume tested by month and progressive (season to date).
- Average test results with comparisons for equivalent period last season.
- Data can be narrowed down into various categories and States.
- Data displayed in graphs or tables.
- Can be viewed on any device including tablets and mobile phones.
- Data can be downloaded as PDF or CSV files.
This service is provided free of charge however users will need to accept terms and conditions of use.
Declaration Rates
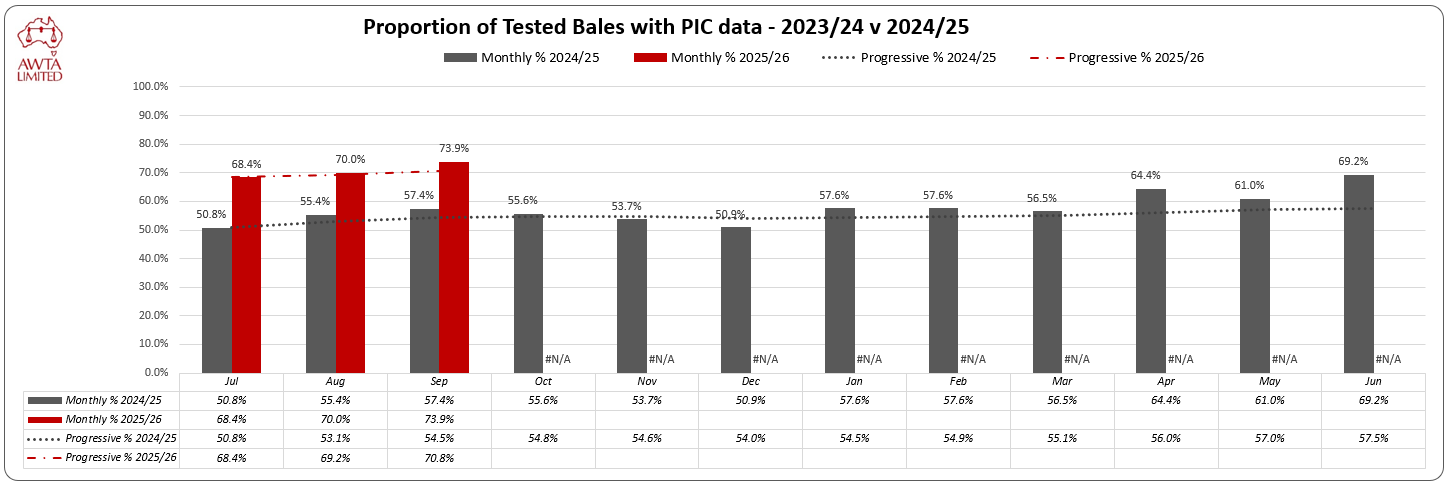
Property Identification Code (PIC) transmission rates:
AWTA stores PICs that are declared by sellers as part of the presale testing process. Only the code is stored in AWTA's database and it remains anonymous as we have no means of identifying or referencing which grower or property these codes represent.
The availability of this data has been identified as a key tool in mitigating the impact of an EAD outbreak, by way of pinpointing affected wool between stores and dumps. A high level of uptake is necessary for this data to be reliable, so work is being undertaken by industry groups to increase it. Monitoring & reporting the transmission rate is a key part of this process, data for which is available below.
Graphs can be downloaded here: AWTA PIC Graphs
PIC transmission - this Season v last Season
The monthly and progressive percentage of tested lots that have PIC declared by sellers.
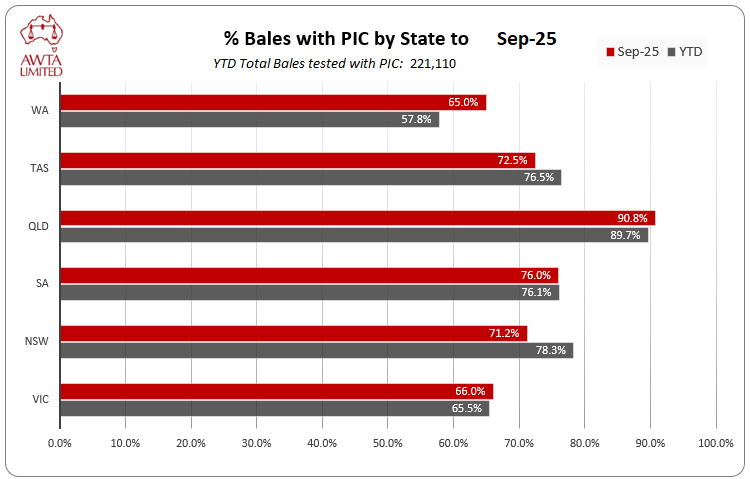
PIC transmission by State
The monthly percentage of tested lots within each state that have PIC declared by sellers.
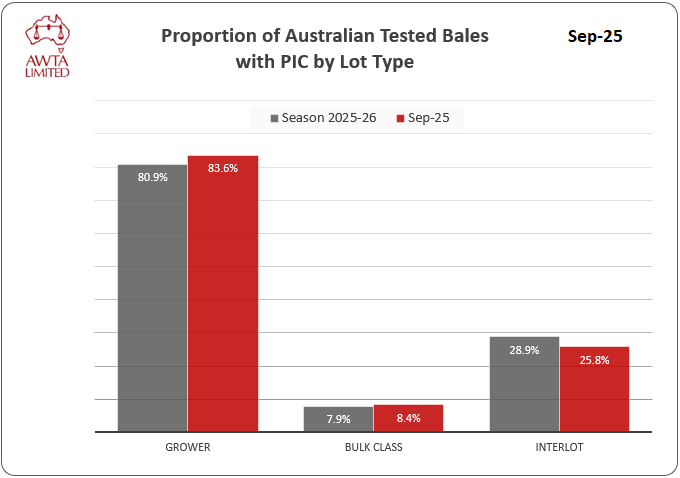
PIC transmission by Lot Type
The monthly and progressive percentage of tested lots by Lot Type (or WPC - Wool Preparation Category) which have PIC declared by sellers.
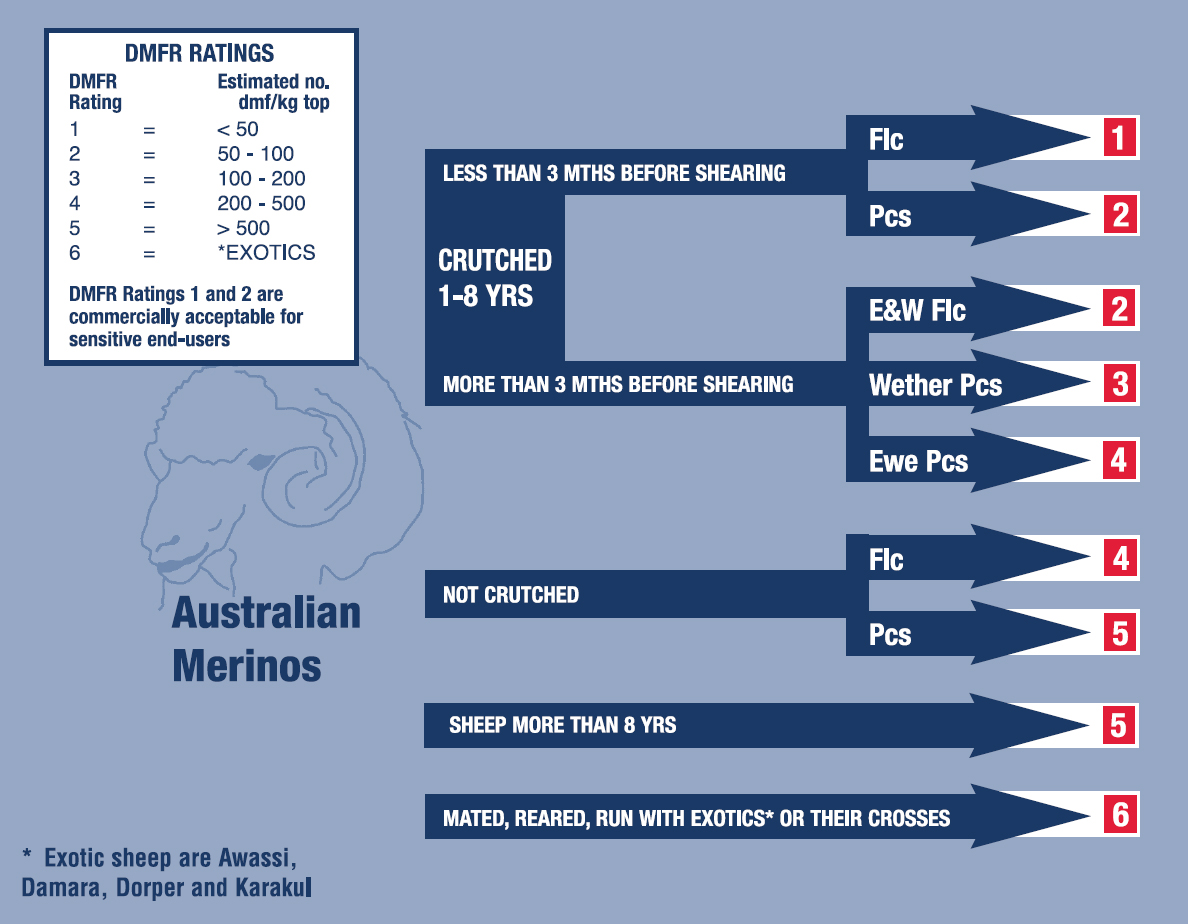
Dark Medullated Fibre Risk (DMFR) Scheme Adoption
|
The International Wool Textile Organisation (IWTO), through its Australian affiliate, the Federation of Australian Wool Organisations (FAWO) promotes a program to protect the reputation of Australia's premium Merino white wool by managing the risk of dark and/or medullated fibre contamination. The program operates through voluntary declarations made by wool growers through the classers specification that accompanies wool deliveries to seelling agents stores and brokers warehouses. This information is forwarded to AWTA who then calculate the risk rating and report in on the Yield & Micron test certificate. The DMFR rating is then displayed in sale catalogues so that buyers can make informed purchases. |
|
Risk Rating Calculation
The aim of this program is to:
- Enable Australia's white wool growers to promote their wool as such to buyers
- Provide buyers and processors with a reliable and quantified measure of the level of dark and/or medullated fibre risk in sale lots. This includes contamination of white wool from traditional naturally occurring pigmentation, stains and from the new source, i.e. from contact with exotic breeds
This is achieved by assigning a Dark & Medullated Risk Rating from 1 (best) to 6 (worst) to sale lots, with ratings 1 and 2 suitable for white or pastel shade end products. This is done according to the following diagram.
More information on the DMFR scheme is available below.
Briefing: DMFR Scheme![]()
Industry Views: DMFR - See What The Mills Say![]()
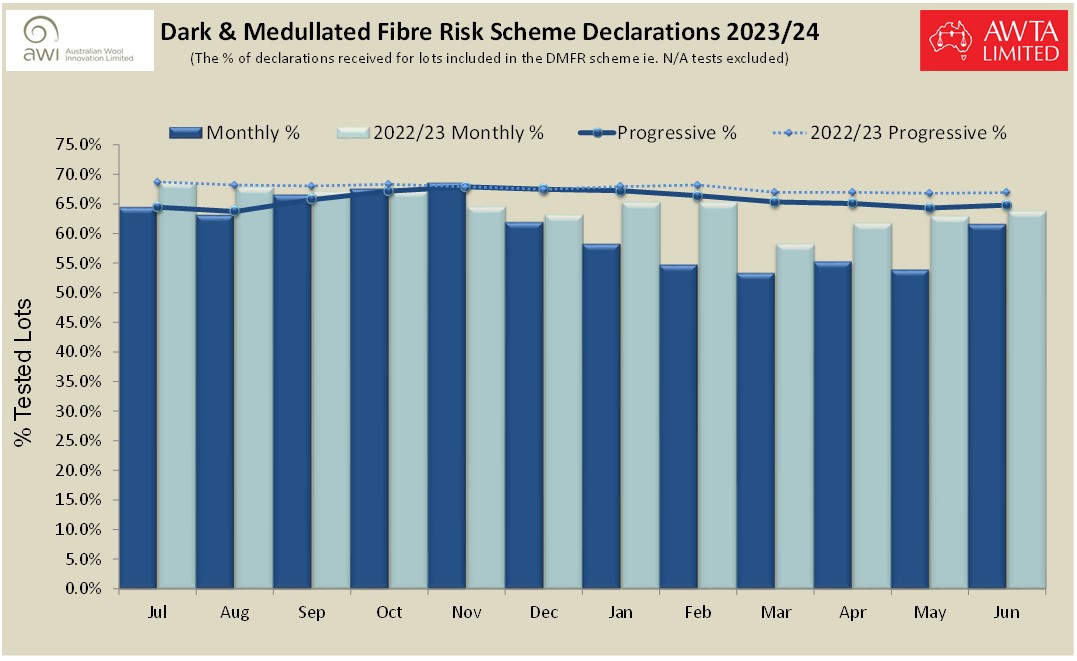
Adoption Rate
The DMFR adoption rate is simply defined as the proportion of tested sale lots that have DMFR data declared by the wool grower. A graph of the DMFR adoption rate, comparing the current and previous season's data is shown below.
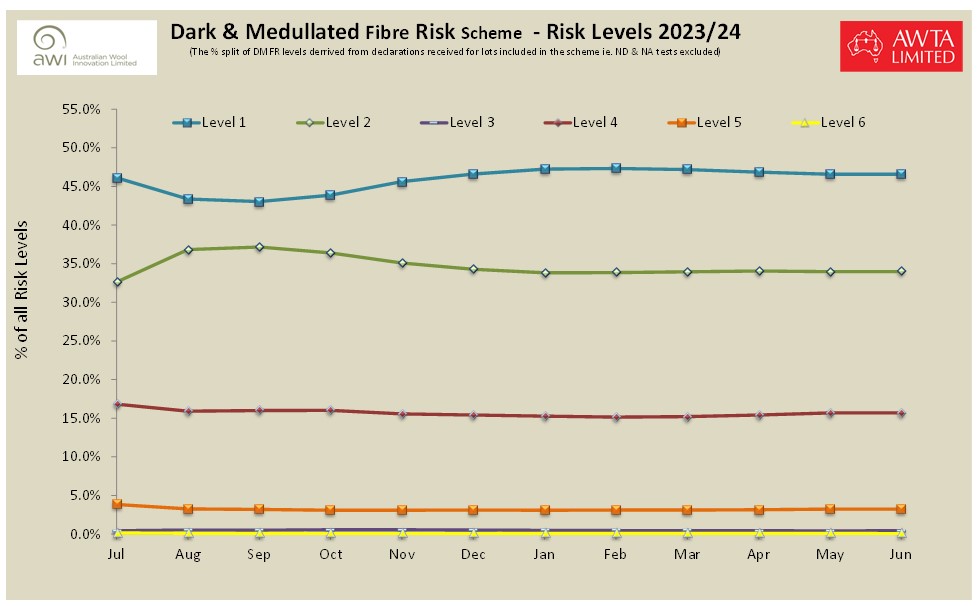
Risk Level Mix
The DMFR Risk Level Mix shows the relative proportion of each risk level in the overall declaration rate. The DMFR Risk Level Mix for the most recent wool selling season is shown below.
Mulesing Status
In July 2008 the Australian wool industry introduced a National Wool Declaration (NWD) scheme. This scheme allows wool growers to declare the Mulesing Status of wool to be tested by AWTA. That category is then displayed on AWTA Test Certificates and in wool auction catalogues.
The Mulesing Status indicates whether wool is produced by mulesed or non-mulesed sheep and, if sheep have been mulesed, whether an analgesic was used to provide pain relief at the time of mulesing. Woolgrowers with sheep that were previously mulesed may also declare that they have since ceased the practice of mulesing.
Mulesing Status Statistics
AWTA Ltd and the Australian Wool Exchange Ltd (AWEX) jointly publish monthly statistics which report the volume of wool both tested and auctioned under the various Mulesing Status categories. These graphs are available on the following link:
https://www.awex.com.au/market-information/mulesing-status/
Further information regarding Mulesing Status Declarations on AWTA Test Certificates is available here:
Volume and Trends
Wool Production & Measurement Trends
AWTA's database contains extensive information for the number of bales tested, the weight of wool tested and associated objective measurements. As almost every lot of wool sold in Australia is certified for Yield and Fibre Diameter before sale, and because the certification services available since 1991/92 have been solely provided by AWTA, this data correlates closely to the production of wool in Australia.
The AWTA's database contains extensive data on the number of bales, weight of wool tested and objective measurements.
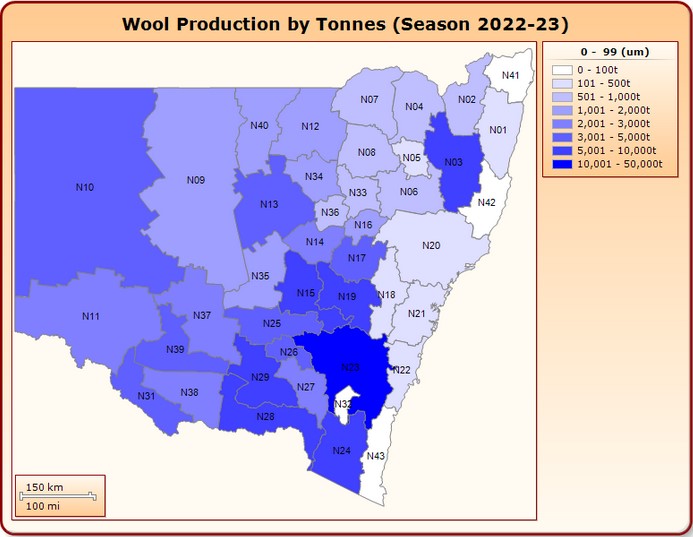
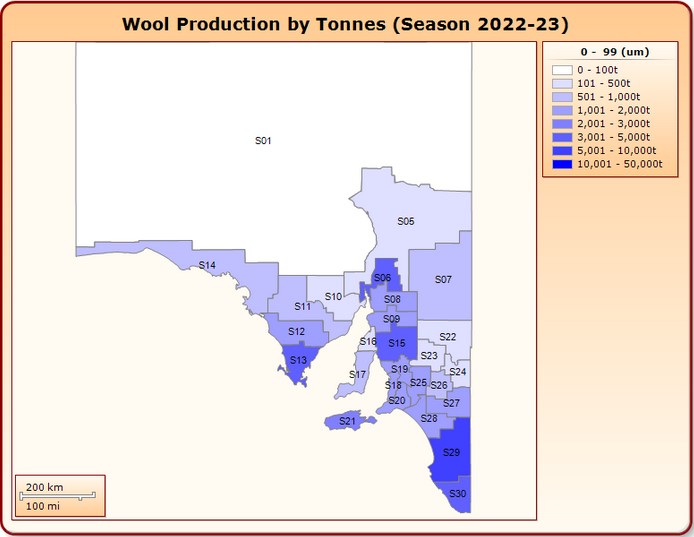
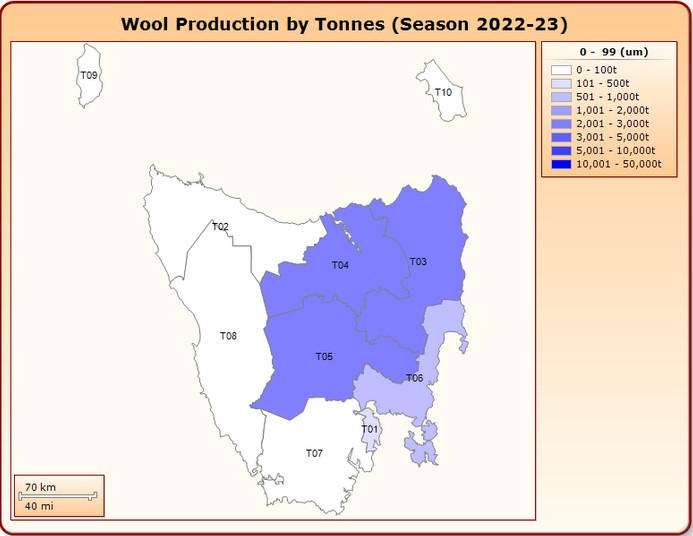
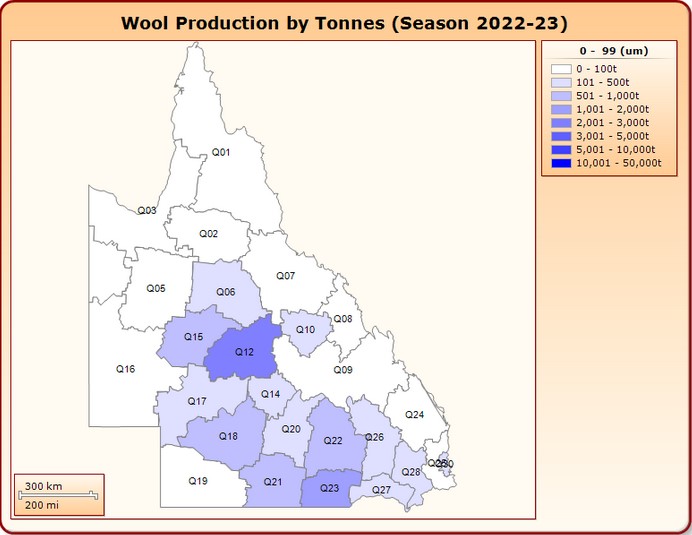
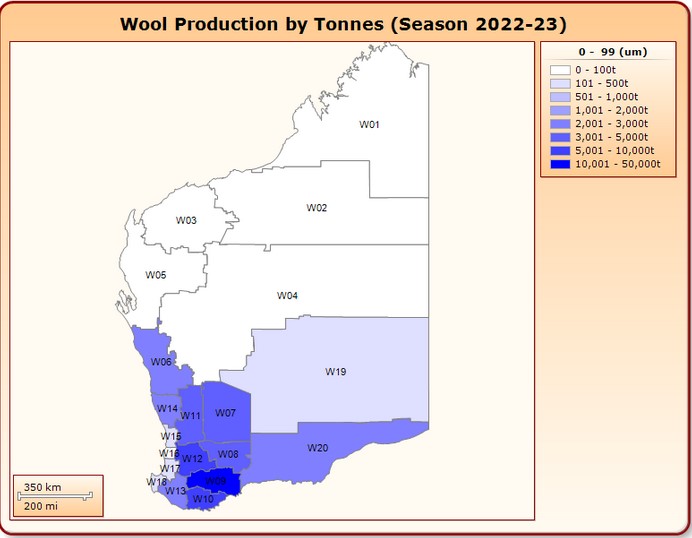
Wool Production by Statistical Area
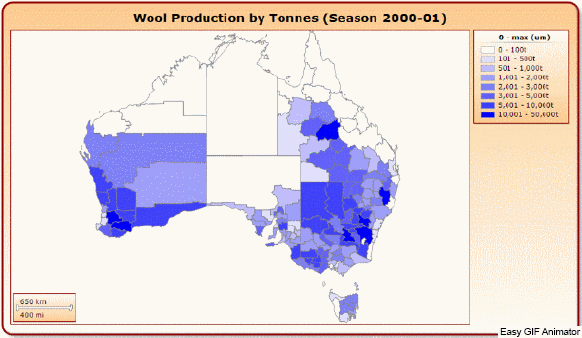
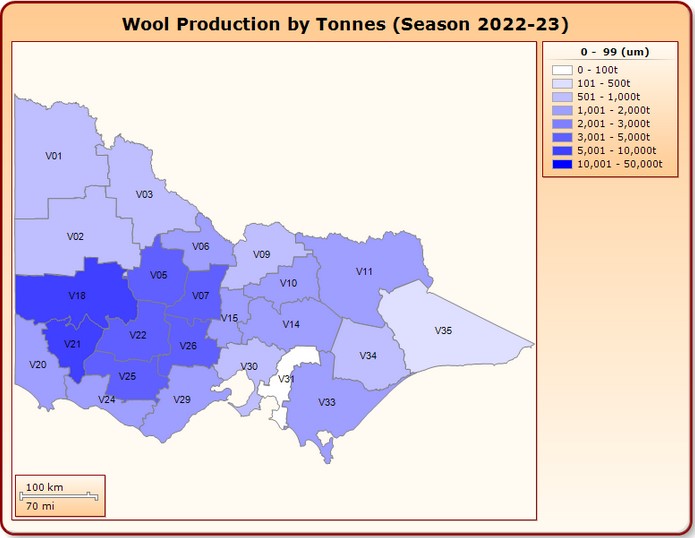
AWTA’s testing database contains extensive information on the origin of wool sampled and the region in which the wool was grown. The sample location is identified by AWTA Sampling officers as part of the certification of sale lots, whilst the region in which the wool is grown (known as Wool Statistical Area – WSA) is declared to AWTA by the Broker/Seller. The image below shows the annual change in WSA-based wool production since 2000.
AWTA’s Key Test Data (KTD) reporting is based on the sample location whereas the data summarised in this section of the website looks at WSA based production. Though the overall comparison of KTD and WSA production levels are consistent, there are slight differences in the figures of each State due mainly to:
- WSA information not being provided by the seller
- The handling and marketing approaches of sellers, whereby wool grown in one area is transported for storage and sale in another state
This data is the basis for the following analysis of trends in wool production.
WSA Production Maps
Displayed below are maps showing the tested wool production within each state by WSA for the last season. Colour graduations are used to show the relative changes in wool production in each area; the darker the colour the greater the amount of wool.
 |
||
 |
||
 |
||
 |
||
 |
|
|
 |
Year-on-Year Comparison by State & WSA
The following charts show the volume of wool tested from each State for the current and previous selling seasons across each Wool Statistical Area (WSA) and the % change from season to season.
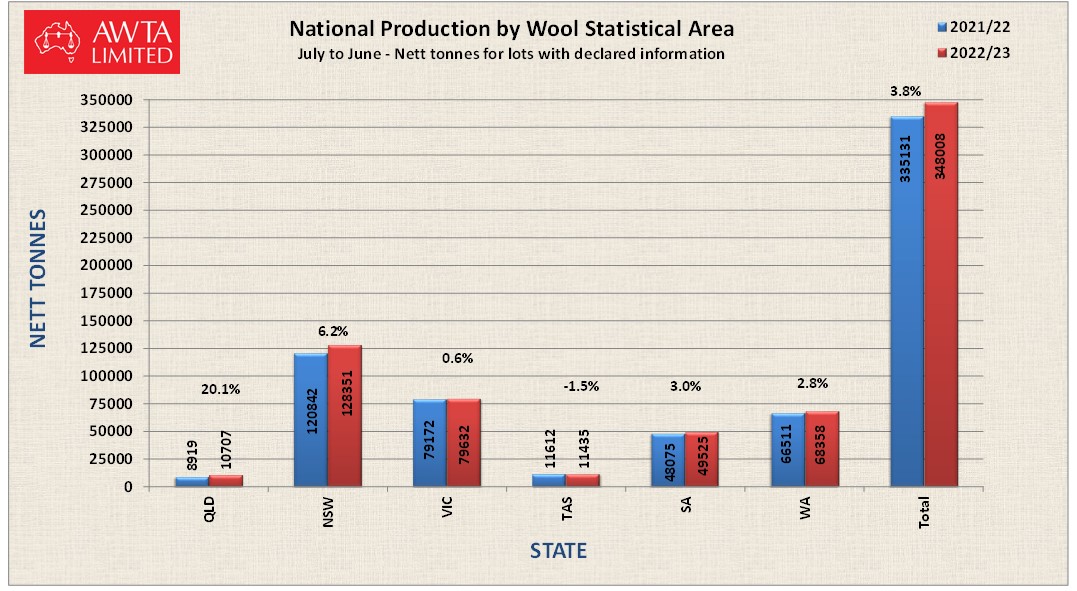
Download a more detailed comparison: AWTA Wool Statistical Area Report - National ![]()
Fibre Diameter
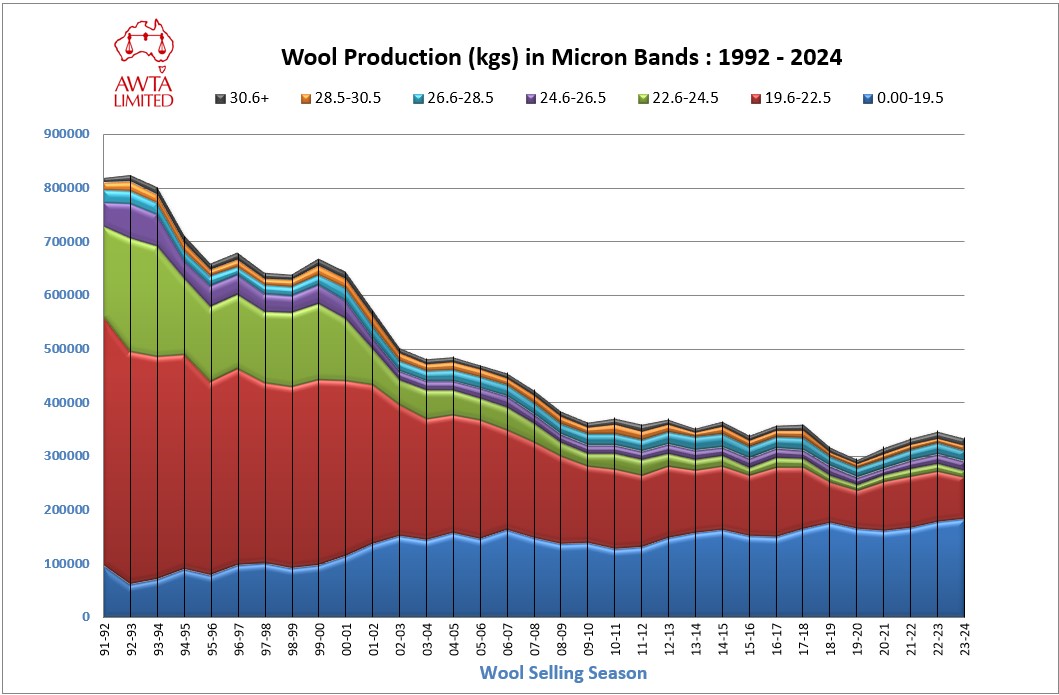
Mean Fibre diameter (Micron) is the single most important measurement used to determine the value of raw wool. The measurement is expressed in micrometres (microns) and refers to the average diameter of fibres in a sale lot. In general terms, the finer the wool the more it is worth. This relationship has led to a lowering of the average fibre diameter over recent seasons, with the proportion of fine wool (ie. <19.5 microns) increasing as a total percentage of the wool produced each year.
AWTA's testing database contains extensive data on the range and distribution of fibre diameter measurements conducted on the Australian Wool clip since 1991/92. The seasonal changes in the micron profile and related production trends are provided for download below.
Trends in Mean Fibre Diameter
Download the full Micron Trends report: Trends within Micron Range
Micron Profiles
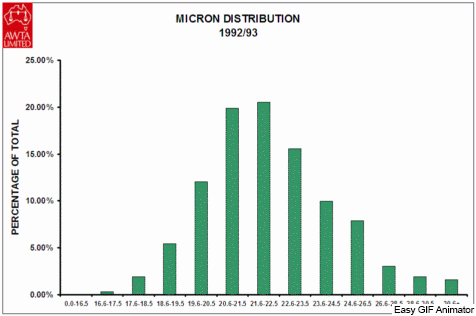
The animated GIF below illustrates the progressive changes to the micron profile of the Australian Wool clip since 1992/93.
The most noticeable change is the significant increase in the proportion of fine wool (<19.5µ) and crossbred wools (26-30µ) since 2000/01 which is reflected by the bi-modal distribution.
Download the full Micron Profile Report: AWTA Historical Micron Profiles![]()
The Finest Certified Tests Measured by AWTA
Australia is renowned for producing the world's best merino apparel wool. Premiums exist for bales of wool with the lowest fibre diameter or 'finest Micron'. There is competition among specialist producers of fine wool to hold or break the record for the finest bale.
The table below is a historical list of the finest sale lots tested and certified by AWTA Ltd. Whilst there may be others that have achieved the same mean fibre diameter (MFD), the lots listed here were the first to be measured at the respective micron values.
|
Tested |
Laboratory |
Brand |
MFDµ |
Method |
| Nov-23 |
Melbourne |
ROWENSVILLE |
10.9 |
L |
|
Jan-16 |
Melbourne |
PYRENEES PARK |
11.0 |
L |
|
Nov-11 |
Melbourne |
HIGHLANDER ULTRAFINE |
11.1 |
L |
|
Jun-11 |
Melbourne |
PYRENEES PARK |
11.2 |
O |
|
Dec-09 |
Melbourne |
HIGHLANDER ULTRAFINE |
11.4 |
L |
|
Nov-08 |
Sydney |
HIGHLANDER ULTRAFINE |
11.5 |
L |
|
May-05 |
Sydney |
HIGHLANDER ULTRAFINE |
11.6 |
L |
|
Mar-06 |
Melbourne |
KADINIA/BRIM |
11.7 |
L |
|
Nov-04 |
Melbourne |
WOOL FACTORY/HORSHAM |
11.8 |
O |
|
Feb-04 |
Sydney |
PRIMERINO |
11.9 |
O |
|
Feb-03 |
Melbourne |
NERRAWAK |
12.0 |
O |
|
Apr-02 |
Sydney |
HIGHLANDER ULTRFINE |
12.1 |
O |
|
Jan-02 |
Melbourne |
NERRAWAK |
12.5 |
O |
|
Apr-01 |
Sydney |
HIGHLANDER ULTRFINE |
12.9 |
O |
|
Mar-00 |
Melbourne |
KARROO |
13.2 |
A |
|
Mar-98 |
Melbourne |
WOOL FACTORY/HORSHAM |
13.3 |
A |
|
Nov-97 |
Melbourne |
WOOL FACTORY/HORSHAM |
13.4 |
A |
|
May-96 |
Melbourne |
WOOL FACTORY/HORSHAM |
13.5 |
A |
|
Mar-95 |
Melbourne |
KADINIA/BRIM |
13.7 |
A |
|
Dec-94 |
Melbourne |
KADINIA/BRIM # |
13.8 |
A |
|
Jan-93 |
Melbourne |
KADINIA/BRIM |
14.3 |
A |
|
Jan-92 |
Melbourne |
KADINIA/BRIM |
14.5 |
A |
# Now known as the "Million Dollar Bale"Note: Methods are:
(L) Sirolan Lasercsan - introduced from July 2000
(O) Optical Fibre Diameter Analyser (OFDA)
(A) Airflow meter (replaced by Laserscan)
Key Test Data
| The Key Test Data Report is updated every month and contains detailed information relating to bales and lots tested by AWTA both for the current and previous seasons. There is also data detailling the comparative changes in Lots, Bales and Weight tested and seasonal changes in the measurement of Yield, Vegetable Matter, Fibre Diameter, Staple Length/Strength and Colour. Further data relating to volumes measured within general Fibre Diamter ranges, plus Superfine and Ultrafine wool trends is also available. | 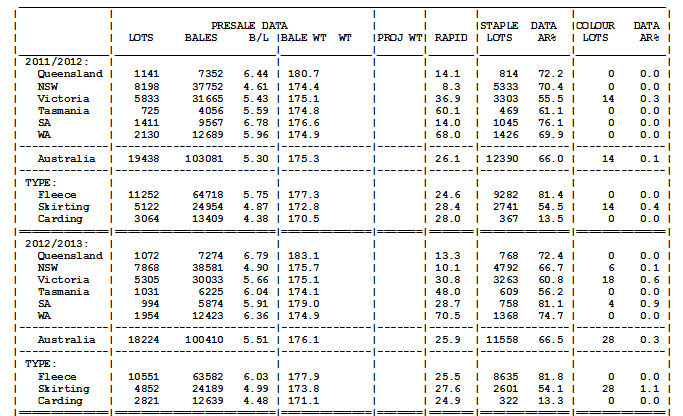 |
To obtain copies of these reports download the appropriate PDF or RTF file using the links provided below.
Monthly Data 2013-14:
Seasonal Data: